Genealogical Network Inference


Genealogical Network Inference


Back to the
“Conservation Genetics” page
Back to the
“LANE”
introduction page

FACTS
‣Most methods available for (leaf-labeled) tree construction have initially been developed for phylogeny estimation among well-differentiated species. However, trees (i.e., following graph theory, “connected graphs with no circuits”) are valid means for portraying genealogical relationships both above and below the species level.
‣Characteristics specific to population data sets are not automatically in conflict with a general treelike genealogy. E.g., an orthologous non-recombining pieces of DNA forms a strictly non-reticulated hierarchical set of relationships across generations. Trees therefore are valid representations of these relationships.
‣Both multifurcations and ancestral haplotypes (often observed, together with more recently diverged lineages, in intraspecific studies) can easily be represented in a tree by collapsing zero-length branches. Therefore, a genealogy connecting intraspecific haplotypes can be displayed using different graphical representations (all being “trees”) including a cladogram, a phylogram, or a haplotypic tree (Fig. 1).
‣On the contrary, trees are inappropriate graphs when instances of reticulate evolution, such as recombination or horizontal gene transfer, come into play. Then, a less-restrictive graph with cycles (“loops”), rather than a tree, better represents the reticulated relationships among genes.
‣In the evolutionary genetics literature, reticulated graphs are often called “networks.” Cycles in these reticulated graphs generally reveal ambiguities such that the unreticulated true genealogy is contained within the reticulated graph. The ambiguities are due to homoplasious character changes, and the loops in the reticulated graph indicate alternative genealogical pathways.
‣On the other hand, a strict consensus tree is a (generally polytomic) tree compatible with all most parsimonious (MP) trees (only clades present in all MP trees are included). It represents a very conservative (i.e., less resolved) estimate of the genealogical relationships among the closely related sequences under study.
‣Therefore, reticulated graphs are useful tools as they can convey more information (especially at the population level) than a strict consensus tree.

PUBLICATIONS
‣Systematic Biology 54: 363-372 (2005)
‣Chapter 5 (pages xx-xx) In “Population Genetics for Animal Conservation”, Cambridge University Press (2009)

PEOPLE INVOLVED
FROM
MILINKOVITCH’S LAB
‣Insa Cassens
‣Patrick Mardulyn

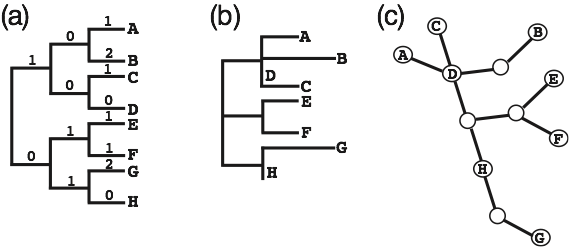
Figure 1. Three different graphical representations of the same evolutionary
relationships among intraspecific haplotypes labeled A to H. (a) A cladogram shows the branching order of nodes, but branch lengths are not represented. The observed numbers of changes that are indicated above the branches have been added for a better comparison with the phylogram. (b) A phylogram shows branching order of nodes as well as branch lengths (proportional to the number of mutations that have occurred). (c) A haplotypic tree in which missing intermediate haplotypes are represented as open circles. “tip haplotypes”, such as A or F, are connected to the tree by a single branch, “node haplotypes” have three or more connections, and “branch haplotypes” have two connections. “Node haplotypes” and “branch haplotypes” can be sampled or missing (e.g., E and F are connected to a missing node haplotype, whereas H is a sampled branch haplotype).
A critical examination of network methods, and development of a new method for genealogical network inference
The investigation of a species population structure, phylogeography and evolutionary history most often requires the estimation and polarization of gene genealogies. At the population level, phylogenetic networks are more convenient than strictly hierarchical trees to represent relationships among closely related sequences because the former allow the display of all equally parsimonious hypotheses (i.e. ambiguous relationships) on a single figure. Furthermore, network construction methods incorporate specifically the possibility for the persistence of many ancestral haplotypes in the population and for the occurrence of recombination events. Although some of these methods are used widely in population genetic studies, little work has been conducted to test the reliability of different algorithms. Similarly, estimating the relative age of haplotypes in intraspecific genealogies has proved to be a highly problematic. Given that hypotheses often depend strongly on the polarization of the inferred trees or network topologies, there is a clear need for the identification of potential artefacts and systematic biases of the different algorithms available.
During our work on the conservation genetics of dusky dolphins & Burmeister’s porpoises, we analysed the 124 DNA sequences of the full mitochondrial cytochrome b gene with several widely used network estimation and rooting methods. The resulting intraspecific gene genealogies and rooting inferences exhibited substantial differences, underlying the limitations of some algorithms. Given that scientific hypotheses and management decisions depend strongly on inferred tree or network topologies, there is a clear need for a systematic comparative analysis of available methods. Furthermore, as available software packages implementing the global maximum parsimony (MP) approach only give the possibility to merge resulting topologies into less-resolved consensus trees, MP has often been neglected as an alternative approach to purely algorithmic (i.e., methods defined solely on the basis of an algorithm) “network” construction methods.
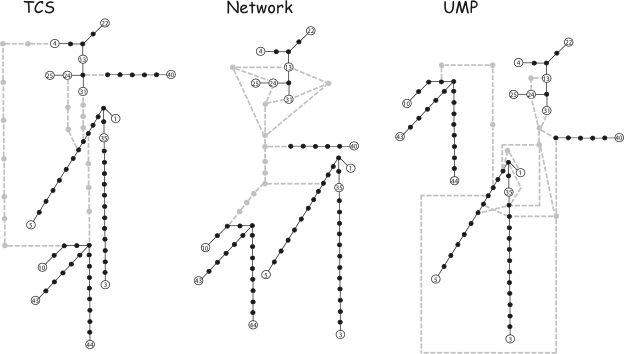
In the publications listed below, we (i) evaluate the advantages and weaknesses of some of the most commonly used network methods, (ii) discuss how to choose an appropriate method for analyzing population sequence data, and (iii) present a new method (named “UMP”) for uniting all equally most parsimonious trees into a single (possibly reticulated) graph. Using simulated sequence data, we compare our method with three purely algorithmic and widely used graph construction approaches (minimum-spanning network, statistical parsimony, and median-joining network). We demonstrate that the combination of MP trees into a single graph provides a good estimate of the true genealogy. Moreover, our analyses indicate that, when internal node haplotypes are not sampled, the median-joining and MP methods provide the best estimate of the true genealogy whereas the minimum-spanning algorithm shows very poor performances.
✓Cassens I., Mardulyn P. & M. C. Milinkovitch
Evaluating Intraspecific “Network” Construction Methods Using Simulated Sequence Data: Do Existing Algorithms Outperform the Global Maximum Parsimony Approach?
Systematic Biology 54: 363-372 (2005)
✓Rosa S., Milinkovitch M.C., Van Waerebeek K., Berck J., Oporto J., Alfaro-Shigueto J., Van Bressem M.F., Goodall N. & I. Cassens.
Population structure of nuclear and mitochondrial DNA variation among South American Burmeister’s porpoises (Phocoena spinipinnis)
Conservation Genetics 6: 431–443 (2005)
✓Mardulyn P., Cassens I. & M. C. Milinkovitch
A comparison of methods for constructing evolutionary networks from intraspecific DNA sequence
Chapter 5 in “Population Genetics for Animal Conservation”, Cambridge University Press (2009)
The software UMP is available HERE